Oligotyping Results for "mock"
A user-friendly interface to make sense of oligotyping results.
» A summary of what happened.
Oligotyping analysis was performed on 859,302 reads from 3 samples for "mock" with oligotyping pipeline version 0.96 (available from http://oligotyping.org) using 2 components following the initial entropy analysis. To reduce the noise, each oligotype required to (1) appear in at least 1 sample, (2) occur in more than 0.0% of the reads for at least one sample, (3) represent a minimum of 0 reads in all samples combined, and (4) have a most abundant unique sequence with a minimum abundance of 50. Oligotypes that did not meet these criteria were removed from the analysis. The final number of quality controlled oligotypes revealed by the analysis was 5, and they represented 859302 reads, which was equivalent to 100.00% of all reads analyzed.
» Meta
| Run date | 16 Jul 13 20:59:21 |
| Library version | 0.96 |
» Given Parameters
| Number of entropy components chosen by the user | 2 |
| Min number of samples oligotype expected to appear | 1 |
| Min % abundance of oligotype in at least one sample | 0.0% |
| Min total abundance of oligotype in all samples | 0 |
| Min substantive abundance of an oligotype (-M) | 50 |
| Quality scores were provided | False |
| Oligotype sets were requested to be generated | False |
» Components used for Oligotyping
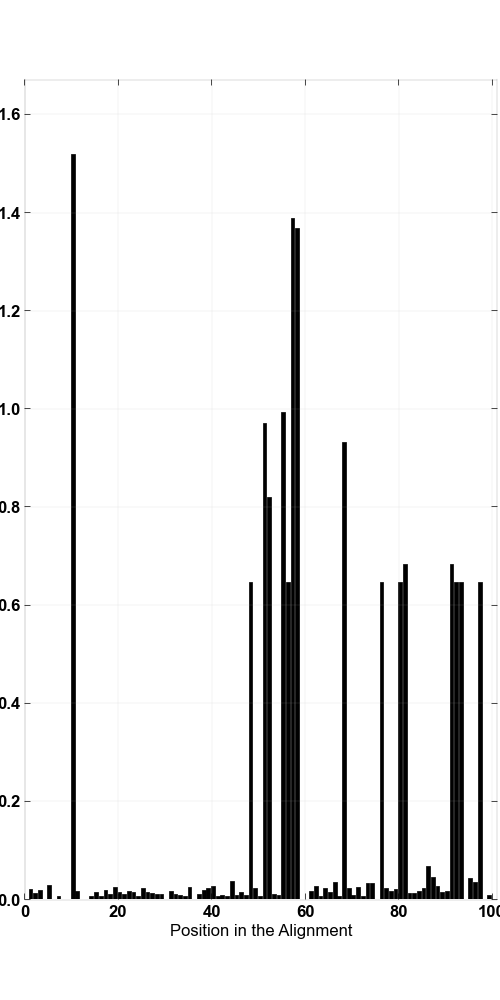
| Base locations of interest in the alignment | 10, 57 |
» Quality filtering results
| Number of sequences analyzed | 859,302 |
| Number of unique oligotypes (raw) | 5 |
| Oligotypes after "min number of samples" elimination | 5 |
| Oligotypes after "min % abundance in a sample" elimination | 5 |
| Oligotypes after "min substantive abundance (-M)" elimination | 5 |
| Number of sequences analyzed | 859,302 |
| Number of samples found | 3 |
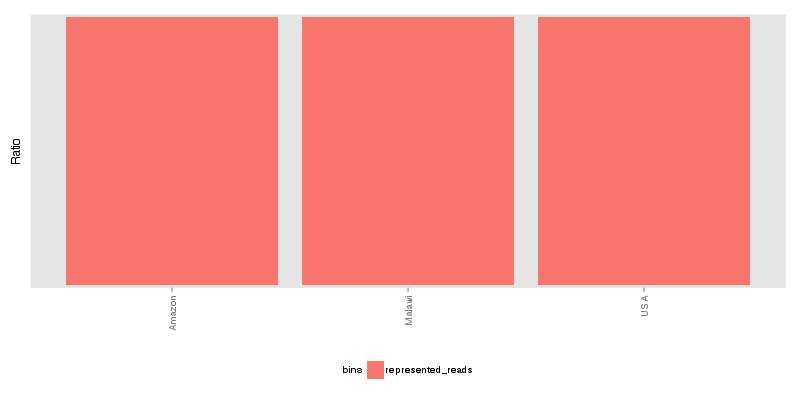
| Number of sequences represented after quality filtering | 859,302 |
| Percentage of reads represented in results | 100.00% |
» Files to analyze results further via third partry applications
| Representative sequences per oligotype | oligo-representatives.fa.txt |
| Sample/oligotype abundance data matrix (percents) | matrix_percents.txt |
| Sample/oligotype abundance data matrix (counts) | matrix_counts.txt |
| Read distribution among samples table | read_distribution.txt |
| GEXF file for network analysis | network.gexf |
| Environment file | environment.txt |
| FASTA file for abundant oligotypes | oligos.fa.txt |
| NEXUS file for abundant oligotypes | oligos.nex.txt |
» Entropy values that components were picked from
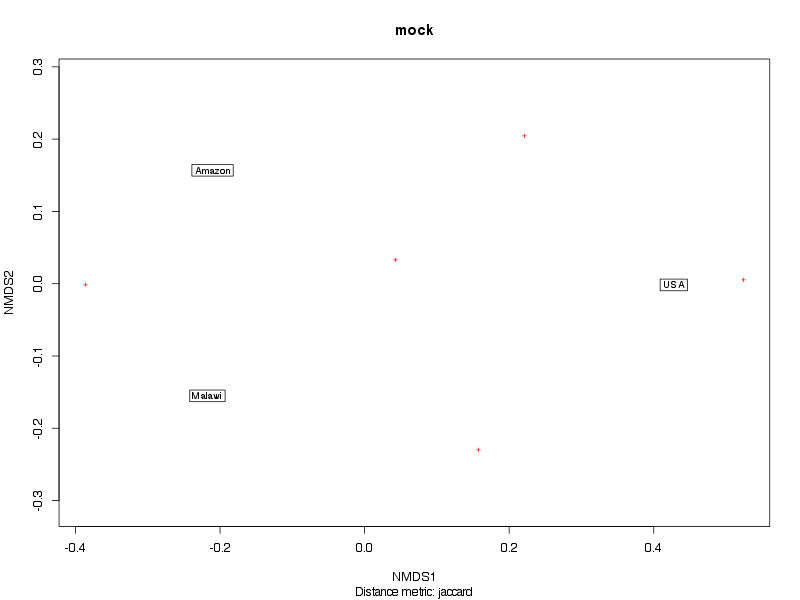
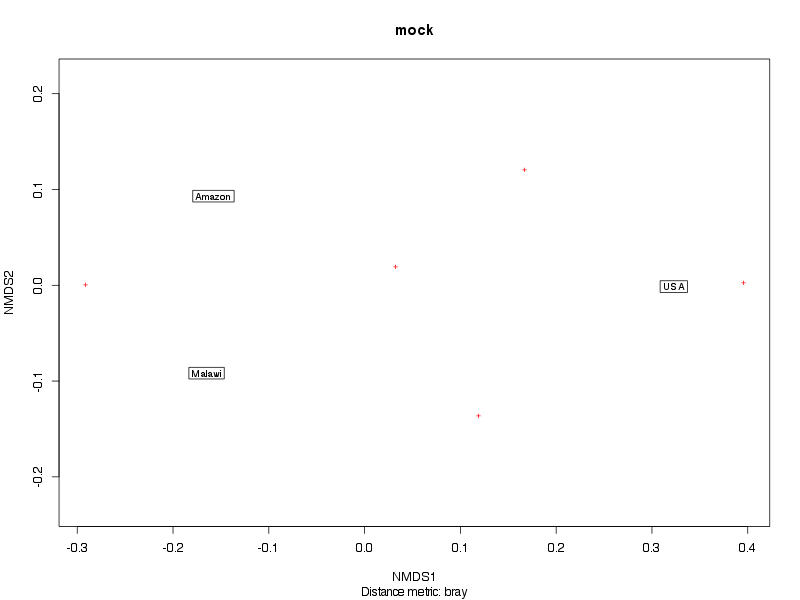
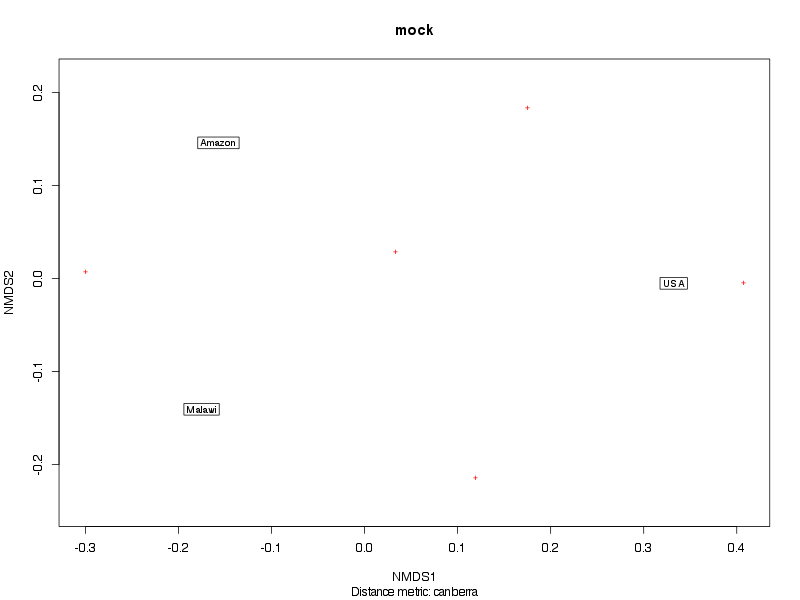
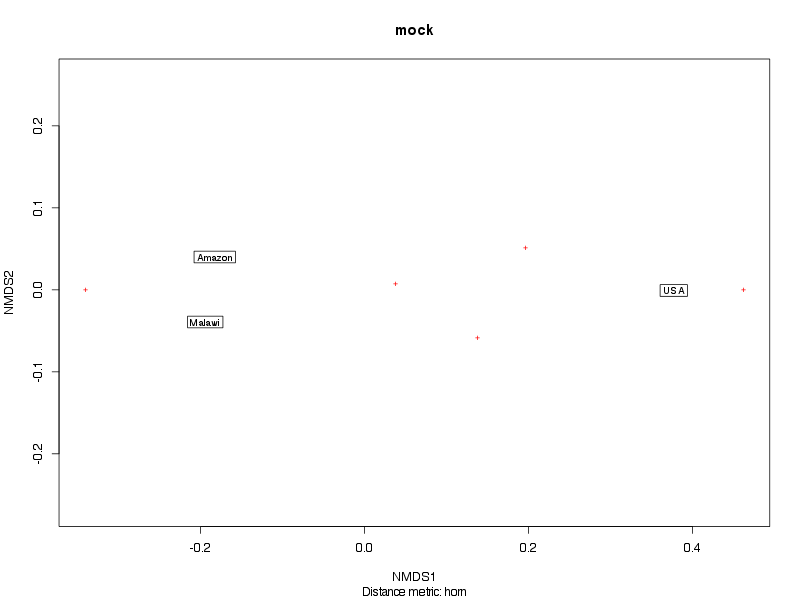
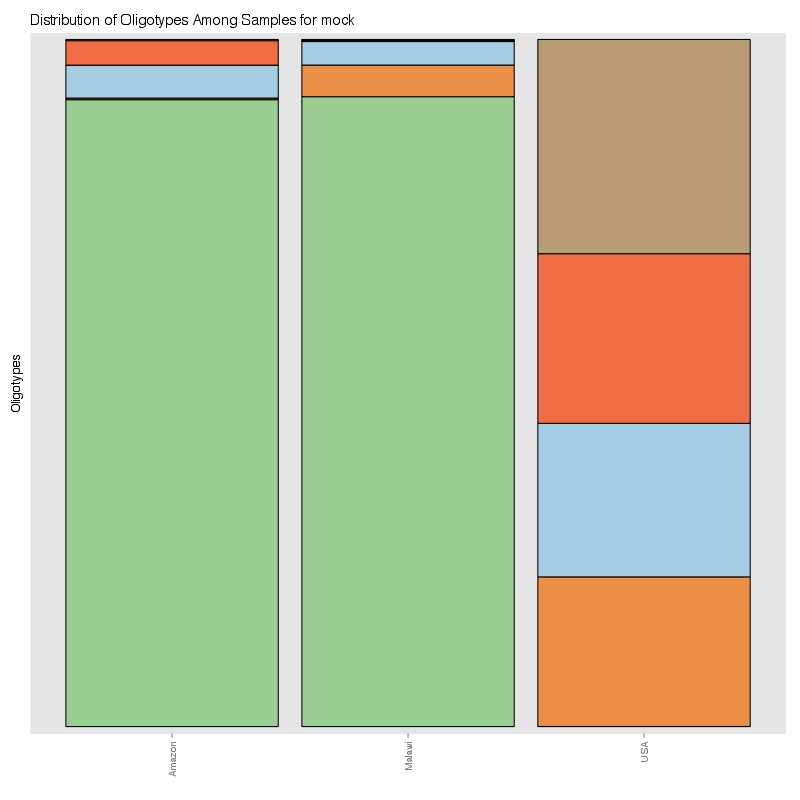
» Figure shows the oligotype distribution profiles among samples. TAB separated files matrix_percents.txt and matrix_counts.txt hold the information that were used to generate this figure.
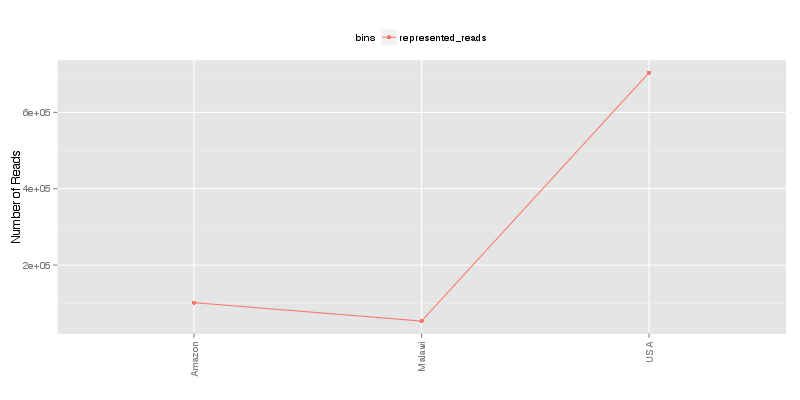
» Total number of reads for each sample that were analyzed.
» Abundant oligotypes along with their frequencies within the project are shown below. Every oligotype is followed by a representative sequence, which is the most frequent read in all reads that were collected by the given oligotype. Mouseover on an oligotype will popup a figure that shows the abundance distribution of unique sequences within the oligotype, along with the new entropy (in an ideal world there should be only one unique read with 0 entropy, but due to the random sequencing errors it is almost never the case). ✓ indicates that the most frequent sequence which was represented by the given oligotype hit something during the BLAST search with 100% identity in NCBI's nr database. In contrary, ✗ sign means that there was no perfect hit during the BLAST search.
CA b |||||||||||||||||||||||||||||||||||||||||||||||||||||||||||||||||||||||||||||||||||||||||||||||||||||
✓ 219,745 CA b TACGGAGGATCCGAGCGTTATCCGGATTTATTGGGTTTAAAGGGAGCGTAGATGGATATTTAAGTCAGTTGTGAAAGTTTGCGGCTCAACCGTAAAATTGC
✓ 177,577 TT b TACGGAGGATTCGAGCGTTATCCGGATTTATTGGGTTTAAAGGGAGCGTAGGCGGGTTGTTAAGTCAGTTGTGAAAGTTTGCGGCTCAACCGTAAAATTGC
✓ 164,043 CT b TACGGAGGATCCGAGCGTTATCCGGATTTATTGGGTTTAAAGGGAGCGTAGGCGGATTATTAAGTCAGTTGTGAAAGTTTGCGGCTCAACCGTAAAATTGC
✓ 155,970 GT b TACGGAGGATGCGAGCGTTATCCGGATTTATTGGGTTTAAAGGGAGCGTAGACGGGTTTTTAAGTCAGCTGTGAAAGTTTGGGGCTCAACCTTAAAATTGC
✓ 141,967 GC b TACGGAGGATGCGAGCGTTATCCGGATTTATTGGGTTTAAAGGGAGCGCAGACGGGACTTTAAGTCAGCTGTGAAATTTTCCGGCTCAACCGGGAAACTGC